Start with the change, not the graphic
A map is useful when the viewer needs to understand where something happened or how places relate to one another. A timeline is useful when the order or duration of events matters. Neither should appear simply because a documentary needs a visual break. Before designing one, write down the question it must answer: Where did people move? Which changes happened first? How long did a process take? That question will help determine what belongs on screen and what can stay in the narration.
Scottish history often resists a single, neat sequence. An account of rural change, for example, may involve different pressures and experiences in different communities. A timeline can establish a broad period while the voiceover makes clear that events did not unfold everywhere at once. The aim is not to fit the whole history into one graphic. It is to give viewers a reliable frame for the next part of the story.
Make the map match the question
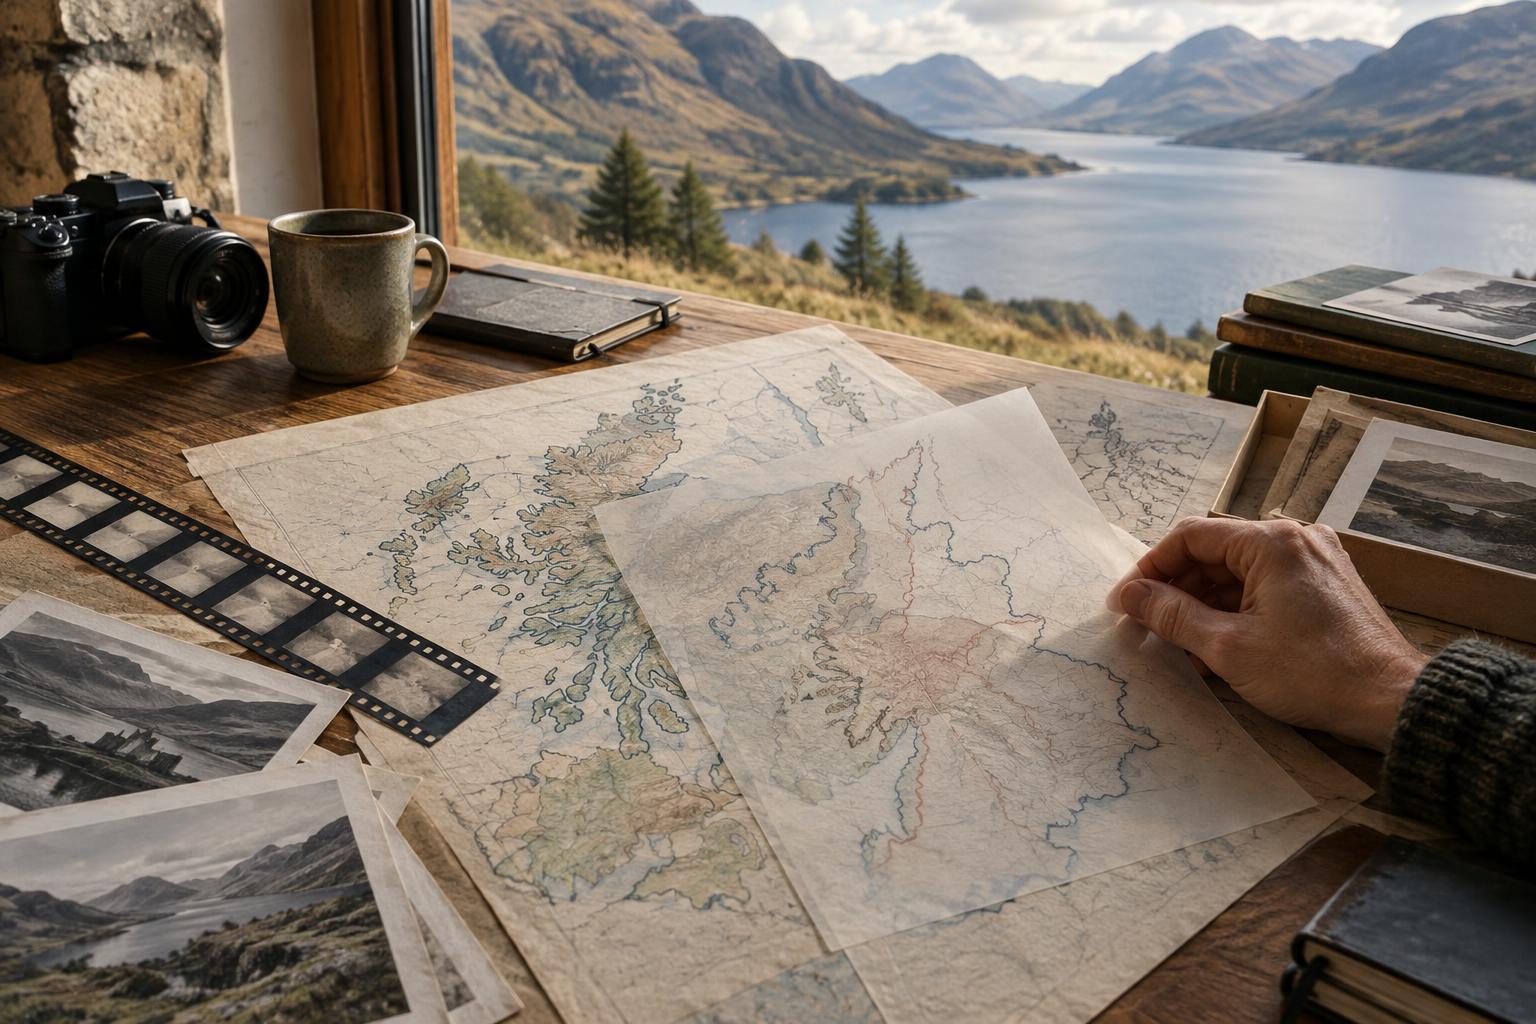
Choose the geographic scale deliberately. A map of Scotland may orient viewers, but it may be too broad to explain a journey between neighbouring settlements. Conversely, a close-up may hide the distance between a community and a destination elsewhere in Britain or overseas. Moving from a wide view to a local one can work well if both views share a recognisable landmark, coastline or place label, so the audience can follow the change in scale.
Every line and shaded area makes an implied claim. Modern administrative boundaries may be convenient, but they should not be allowed to suggest that the same divisions applied in the period being discussed. A route arrow can show a direction without pretending to trace every traveller’s path; a shaded region can indicate an area of focus without defining the exact extent of an experience. Labels such as “approximate route” or “area discussed” are often more honest than a deceptively precise shape.
Show time as duration, not just a string of dates
On-screen timelines tend to favour a few memorable points: a decision, a departure, a building opening. Historical change also happens between those points. Where appropriate, use a band or span to show a process that took years rather than a single marker that makes it look instantaneous. Separate the date of an event from the date of a surviving photograph or film clip; footage made later can illustrate a place, but it cannot serve as a direct view of an earlier moment.
Pacing affects meaning. If a century passes in two seconds while one year receives a long animated sequence, viewers may infer that the brief sequence matters more. That may be the editorial intention, but it should be considered rather than accidental. Pause long enough for people to read dates and labels. When moving between local developments and wider events, keep the timeline’s scale visible so the viewer knows whether a small movement represents months or decades.
Let sources and uncertainty shape the design
Build graphics from the evidence available, not from the animation you would like to make. A source may support the location of a town but not the exact course of a journey. Another may establish that a change occurred over a broad period without fixing its beginning to one year. In those cases, approximate labels, ranges or restrained animation can communicate more faithfully than a crisp dot appearing on a precise date.
This matters when working with archival images. A map layered over a photograph can look authoritative even if the photograph is merely illustrative. Identify images according to what is known about them, and avoid styling a newly created map or timeline to resemble an undiscovered period document. If the film uses a reconstruction, describe it as one. Viewers should be able to distinguish surviving evidence from a visual explanation made for the documentary.
Keep the viewer oriented and the story human
A clear graphic rarely needs many moving parts. Use a consistent colour for each route, group or period, and make important labels legible without relying on colour alone. Give place names time to be read, especially when several appear together. For viewers listening rather than watching closely, narration should state the essential relationship the graphic shows; the image can then add detail instead of carrying the whole explanation.
Finally, return from the overview to a place or person. A map of movement across Scotland can establish scale, but it cannot by itself convey what leaving, arriving or remaining meant to the people involved. A timeline can clarify sequence, but it cannot explain every cause. Used alongside carefully identified testimony, objects, locations and archive material, these graphics offer a way into the story. Their best work is to make complexity easier to follow without making it disappear.